Chart Patterns:
There are three main groups of chart patterns:
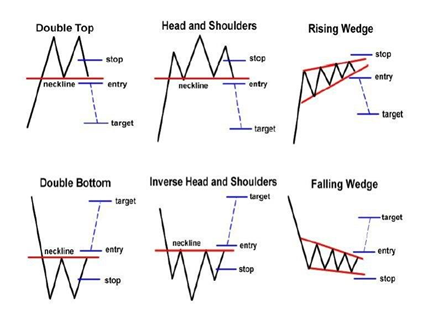
1. Reversal patterns
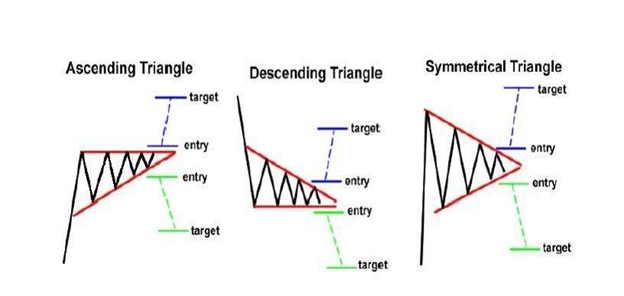
2. Continuation patterns
3. Bilateral chart patterns
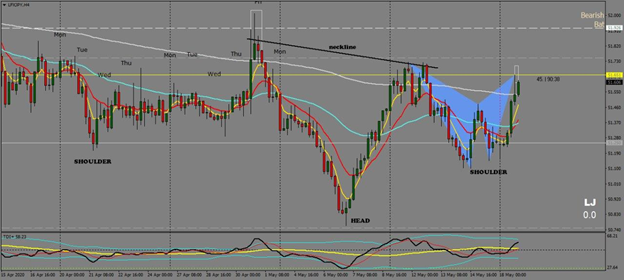
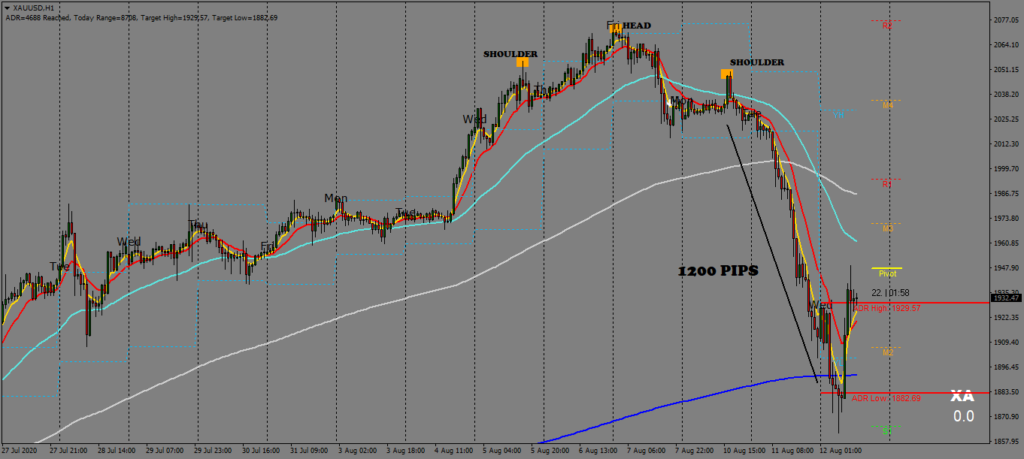
Reversal patterns are those chart formations that signal that the ongoing trend is about to change course.
If a reversal chart pattern forms during an uptrend, it hints that the trend will reverse and that the price will head down soon. Conversely, if a reversal chart pattern is seen during a downtrend, it suggests that the price will move up later on.
These are patterns we should identify in the market, around reversal areas.
Trade under FxSway broker. Broker made by traders, for traders. Click the link to sign up now: https://fxsway.com/?refid=1625514873823
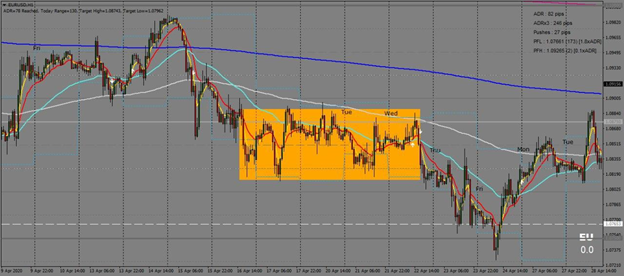
Continuation chart patterns are those chart formations that signal that the ongoing trend will resume.
Usually, these are also known as consolidation patterns because they show how buyers or sellers take a quick break before moving further in the same direction as the prior trend.
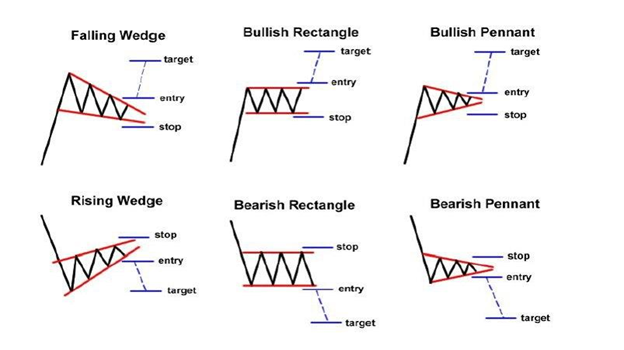
Bilateral chart patterns are a bit trickier because these signal that the price can move either way.
These are patterns we shouldn’t be looking for in the market. As a trader you must always have an anticipated view of the market.