Technical analysis allows traders to use charts to predict future price movements. Indicators are added to help traders in many ways if they are properly used.
I, personally, use a variety of indicators in my analysis, entries and exit points. One thing I have learnt about indicators is that, they are mathematical tools and they usually lag behind. Relying on them alone will give you a great amount of loss.
Indicators are formula that uses past data and allegedly predicts future price movement. The only problem about patterns and indicators in the market is that trader are really not sure if price will interact with the patterns or follow what the indicator says.
It is different from the stock market where traders have all the information on the order book of the exchange. In FX market only the market makers have that information. Retail traders’ trade blindly, at least there are a few tricks that are revealed but we still do our analysis horizontal. This is a quote driven market.
These indicators simply alerts you about a possible reversal, or a continuation of a trend.
Important indicators that I use:
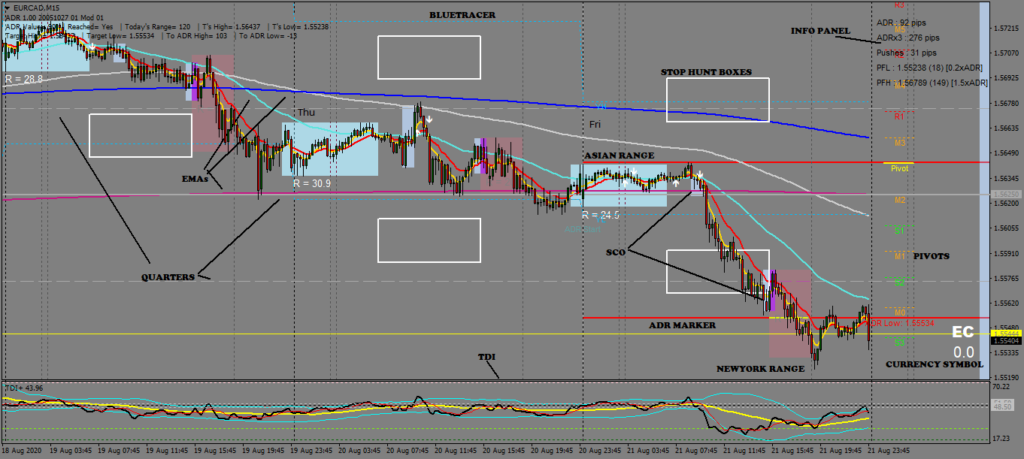
1. Session indicator – they simply draw boxes to show a session in the market. From Asian, London to network
2. Average daily range – calculate the average number of pips moved in 15 days by a pair. This can give us the daily number of pips a dealer can move in the next day. Note that, this is an average, +/- is likely to occur.
3. Fractal – Plots swing high and swing lows
4. Fibonacci trading tool and pivot points – give us possible resistance and support retracement levels. The induced support and resistance points in a trending market.
5. Traders dynamic index – contains RSI with a period of 21 with shows divergence areas indicating possible reversals in the market. When RSI price line reaches the extreme levels, usually the current trend is about to be over. It is wise to start looking for reversals.
6. Exponential moving averages – these are the tricky ones, crossovers can signal continuation of trend. But market makers can reverse the market and the calculations fed in the indicator revoked, another crossover will be seen. It is wise to use exponential moving average than the simple or weighted moving averages. Stochastic graphs are naturally exponential. Let’s go deep now…
EMA continuation……
In a market maker trend:
H1 Timeframe:
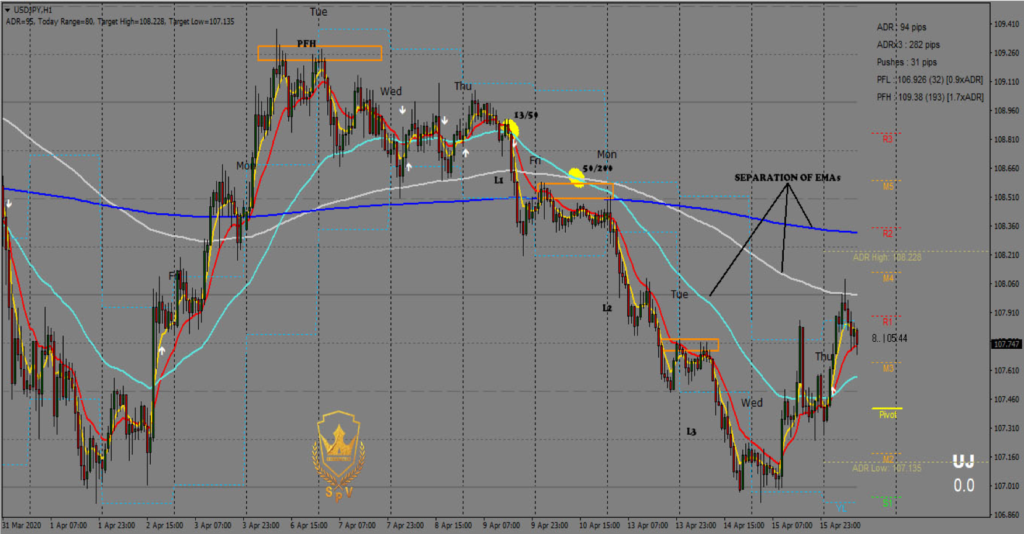
13/50 crossover indicate level 1 lock but it should never be used as a confirmation for a continuation of a trend.
50/200 crossover indicate level 2 lock, it doesn’t confirm a continuation of a trend either.
Level 3 – I was taught in price action the separation of EMAs indicate a strong momentum of a trend. I still remember these words from a YouTube video + my mentor + a book named 17 proven strategies. But the sad reality is 👉 it indicates the end of the trend. Knowing that these indicators lag, these separations will occur when price has far reached near the end of the trend. If your mentor shows you a flashcard, it would seem to be the reality of a strong momentum but its not that way.
Trade under FxSway broker. Broker made by traders, for traders. Click the link to sign up now: https://fxsway.com/?refid=1625514873823
Those using naked charts should never discourage those using indicators, and vice versa. In fact we need liquidity and every trader need to have his/her own bias on the direction of a trend for that liquidity to be there. I urge you to know the appropriate uses of each indicator. You should always know other factors driving the market, don’t follow indicators blindly.
Trade under FxSway broker. Broker made by traders, for traders. Click the link to sign up now: https://fxsway.com/?refid=1625514873823