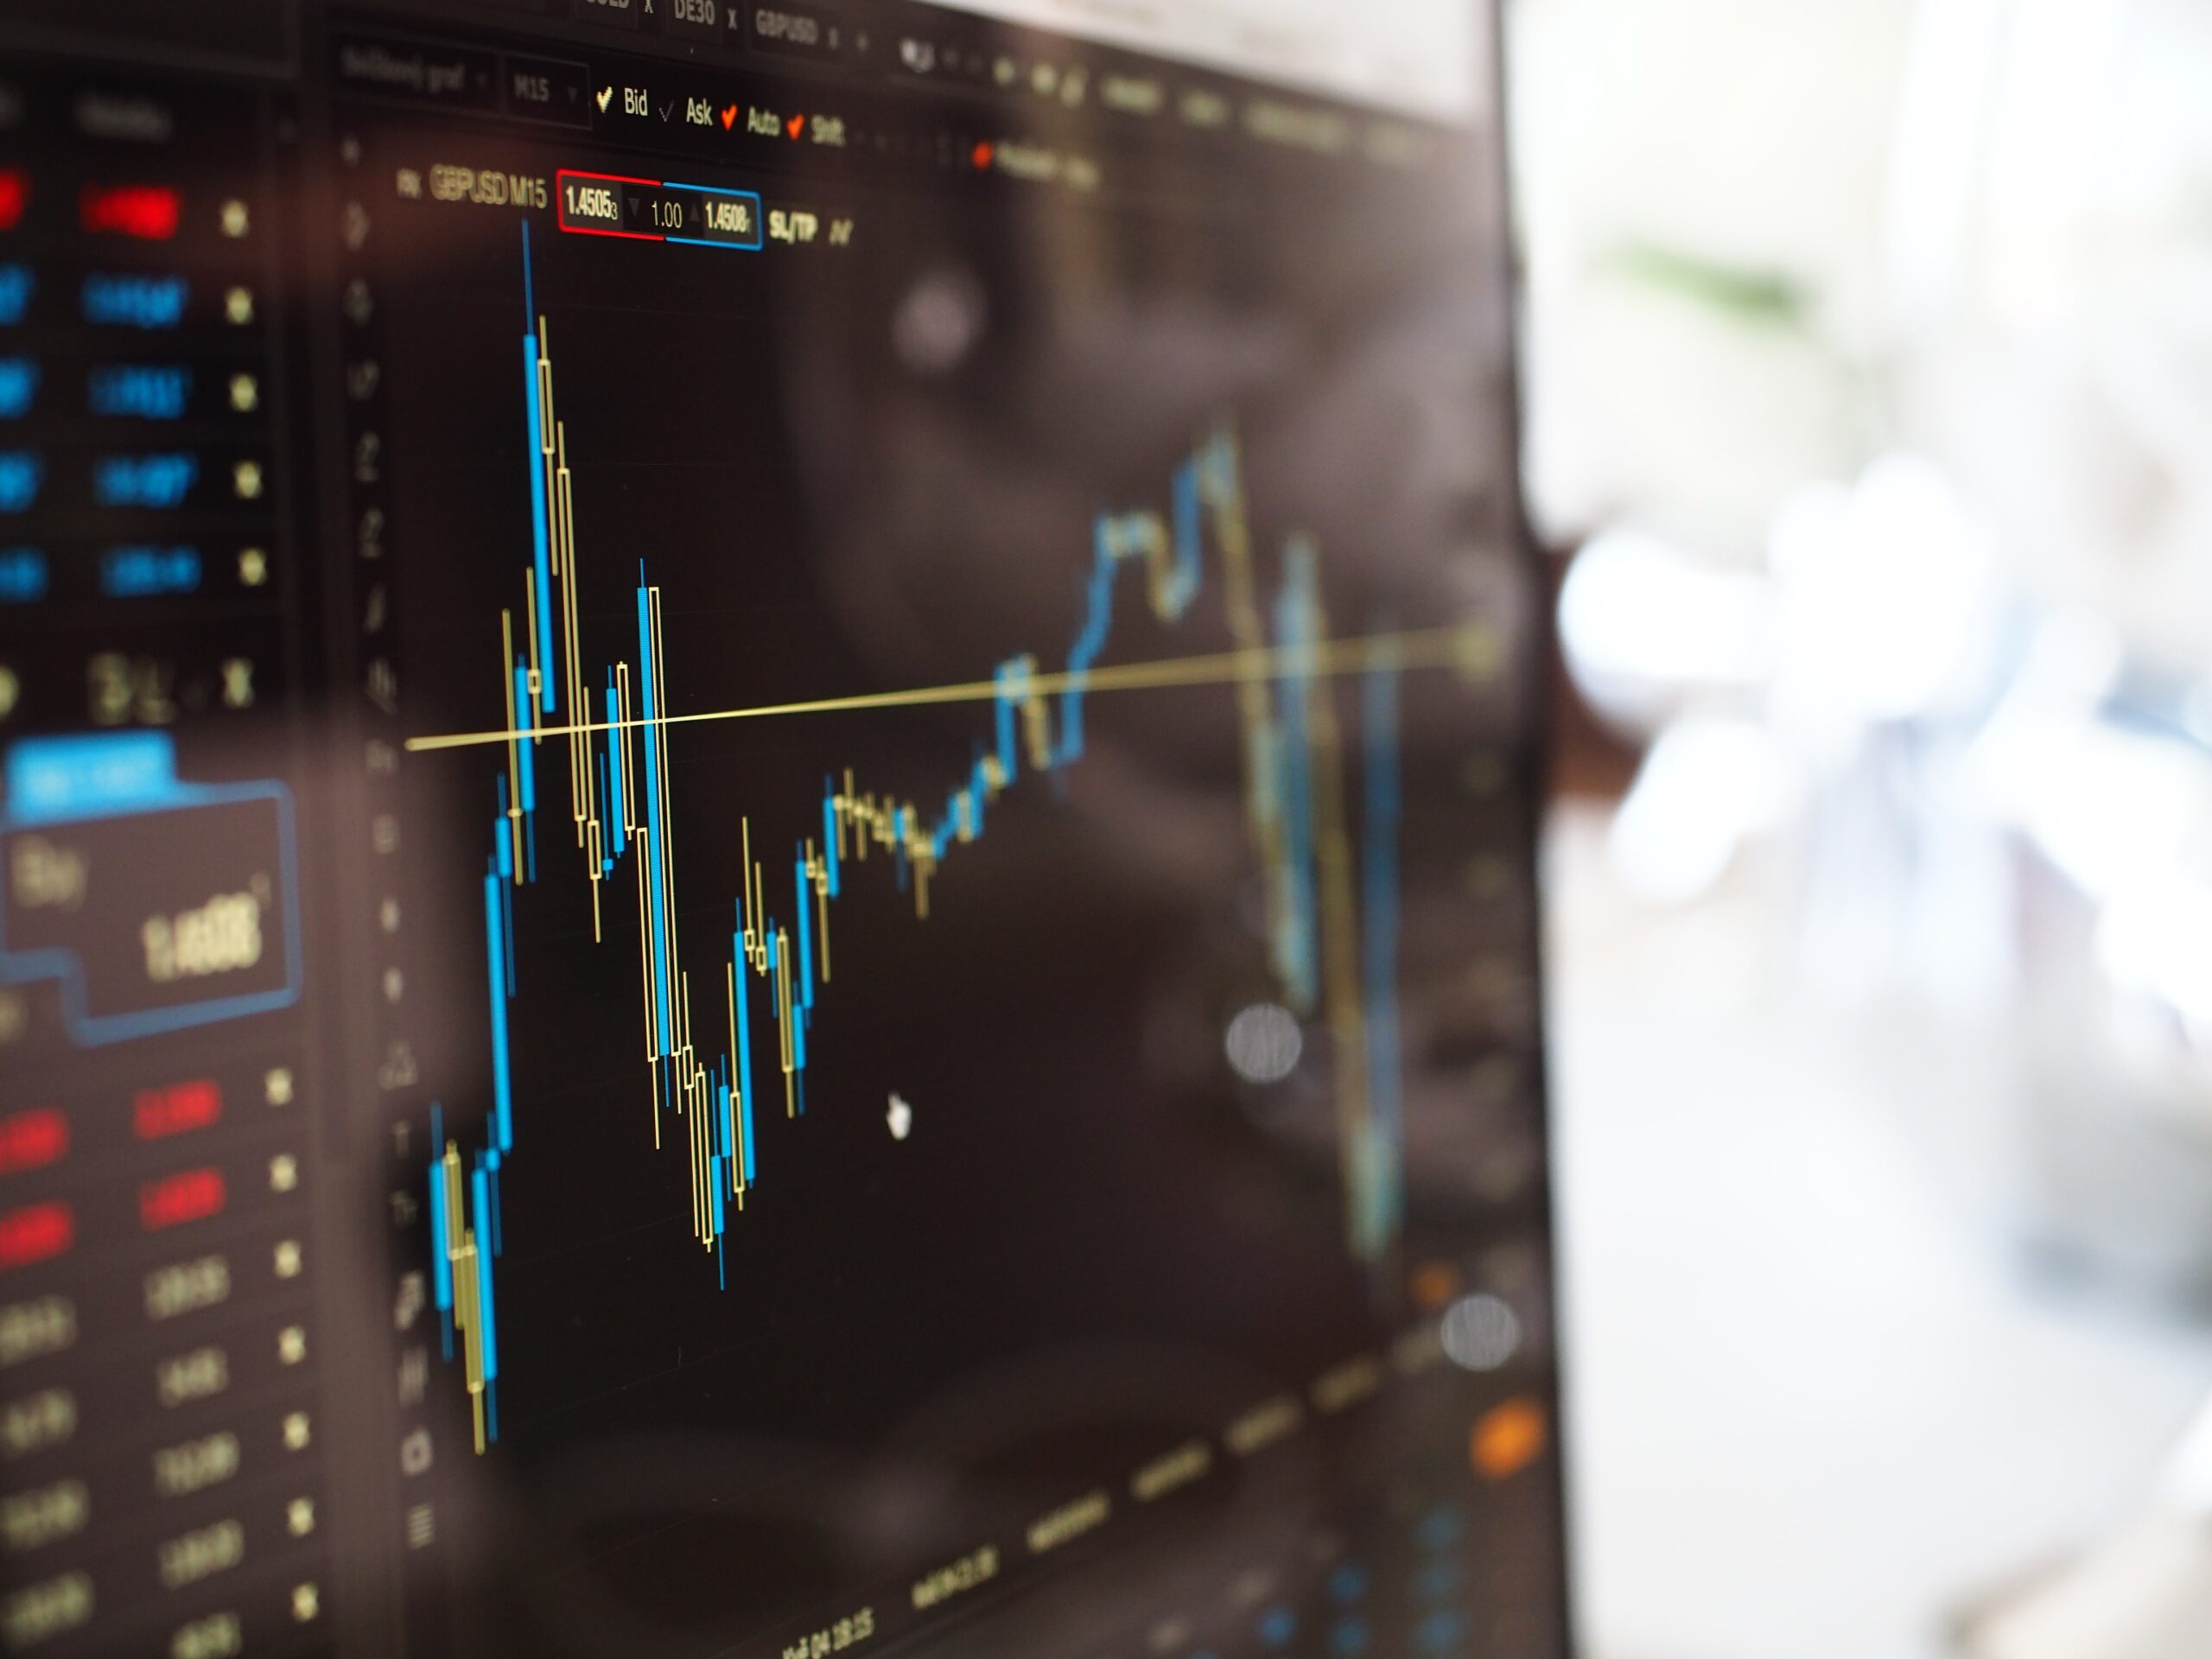
Let’s consider an ordinary trader and look at what he/she sees (uses) on own chart every day. So, first things first:
- Indicators are formula that uses past data and predicts something.
- Lines, channels, supports, etc. In this case, they are effective to a certain degree.
- Patterns, formations, and waves. Again, one cannot know in advance whether the price is going to interact with this pattern. However, most traders see simple patterns, so some interaction of the price with them can be still seen.
The list goes on, but that’s enough for us. Considering all of this, we can conclude that traders analyze the market horizontally. That is, we take some historical data (chart), seek for regularities, draw lines, but with all that, we don’t know what is actually happening there and why the price did not obey our indicator.
With my strategy we learn many things concerning price and how it should react in certain levels in the market. We basically have learn the market (dealer’s) sentiments and we are far better than just ordinary traders. The strategy is called MQP Alloy, and has proved to be the best in forex trading up to date. You want to know on how we analyze the market, click the link below.
Trade under FxSway broker. Broker made by traders, for traders. Click the link to sign up now: https://fxsway.com/?refid=1625514873823
Learn more:
Trade under FxSway broker. Broker made by traders, for traders. Click the link to sign up now: https://fxsway.com/?refid=1625514873823


