Technical analysis simply means speculation using the charts. Here we look on price action and chart patterns. We also use indicators.
Things to learn:
- price behavior
- candlestick patterns
- chart patterns
- trend lines
- indicators
Trade under FxSway broker. Broker made by traders, for traders. Click the link to sign up now: https://fxsway.com/?refid=1625514873823
Price action:
Price action is a trading technique that allows the trader to analyze the market and make subjective trading decisions based on past and present price movements.
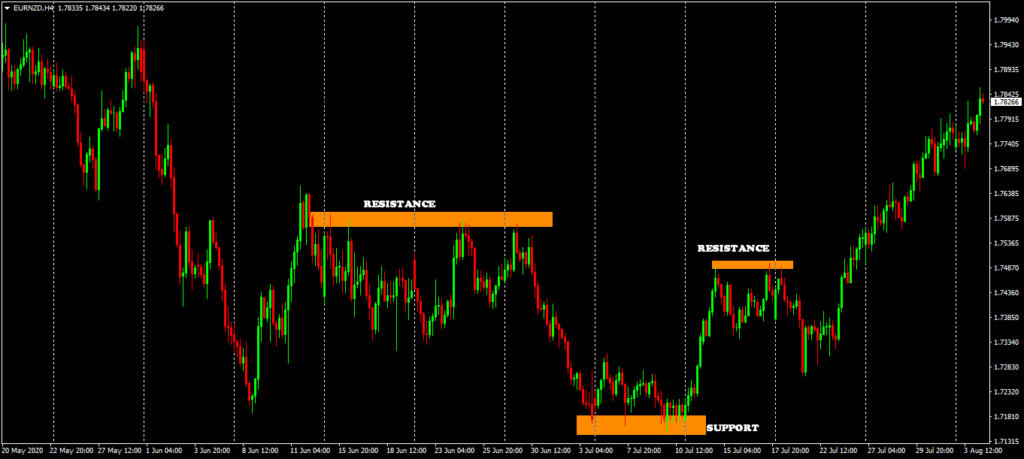
In price action we define support and resistance point as:
Support: Lowest point the price reaches before reversing.
Resistance: Highest point the price reaches before reversing.
These are areas of interest that traders should look for price to reverse once touched again in the future.
Basically in higher time frame, before price reverse. Market will form equals lows or equal highs.
A support area becomes valid when price bounces twice on that same price level i.e. when price forms equal lows. A resistance area becomes valid when price bounces twice on that same price level and reverse i.e. forms equal highs.
Trade under FxSway broker. Broker made by traders, for traders. Click the link to sign up now: https://fxsway.com/?refid=1625514873823
Once price reaches an area of support or resistance then we should look for signs of weakness or strength. If there are signs of weakness then price might break that area and move to another level of S/R. If there are signs of strength then price might reverse.
what are the signs of weakness and strengths? Learn more from our blog articles
Trade under FxSway broker. Broker made by traders, for traders. Click the link to sign up now: https://fxsway.com/?refid=1625514873823