
When used right, Exponential Moving Averages (EMAs) are more than just lines on a chart. They’re a map—a way to read the market’s direction, momentum, and timing.
At ForexSPV, we use EMAs not as a standalone system, but as part of a structured entry and reset strategy that helps traders avoid noise and enter with confidence.
🔄 The Key EMAs and Their Role
Each EMA carries a role in how price reacts and moves. Here’s how we label them:
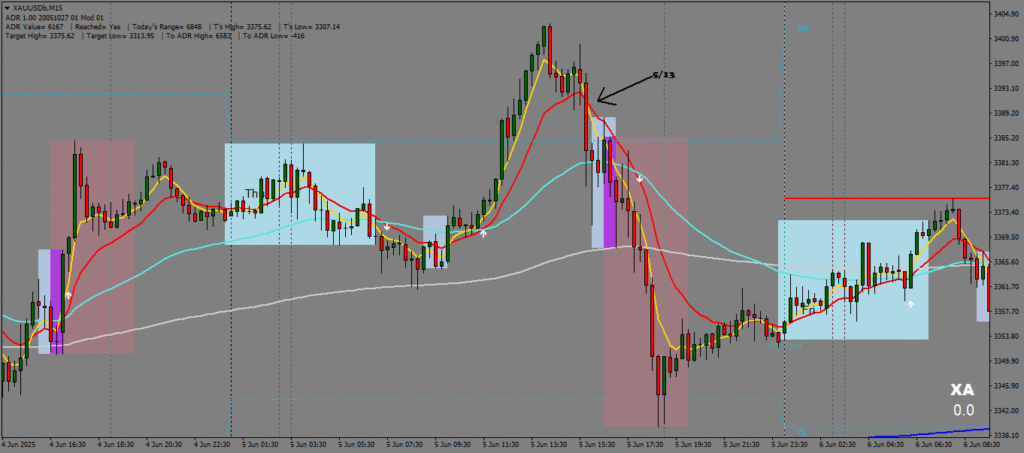
- 5 EMA (Yellow – Mustard): Fast market reaction.
- 13 EMA (Red – Ketchup): Short-term confirmation.
- 50 EMA (Light Blue – Water): Structure and bounce zone.
- 200 EMA (White – Mayo): Long-term market filter.
- 800 EMA (Dark Blue – Blueberry): Major turning points.
- 3200 EMA (Medium Violet Red): Rare but powerful resistance.
🕒 Timeframe-Based EMA Strategy
On M15:
- Use 5/13 EMA for entry confirmation.
- 50/200 EMA gives Level 01 lock and trend strength.
- ID50 trades are taken on 50 EMA rejection, while Blueberry trades occur around the 800 EMA peak.
- 200 EMA acts as your bounce or reset filter.
On H1:
- 13/50 EMA crossover confirms Level 01 lock.
- 50/200 EMA for Level 02.
- A strong EMA fan-out indicates Level 03 and trending market conditions.

Higher Timeframes (H4 & D1):
- Use 200, 800, and 3200 EMA as moving support and resistance zones for long-term analysis.

🎯 Why This Matters
New traders often enter too early or too late. EMAs help bring clarity. For instance:
- When price pulls back to 50 EMA, but the 5/13 remains bullish, you may be looking at a continuation trade.
- When price stalls at the 800 EMA on M15 or H1, it could signal an EMA Peak or a peak reset—a sign to prepare for a reversal.
✅ Final Tips
- Never trade EMAs in isolation—combine them with structure.
- Use them to filter noise, not chase signals.
- And always remember: the market respects levels, not emotions.